Stats Overview
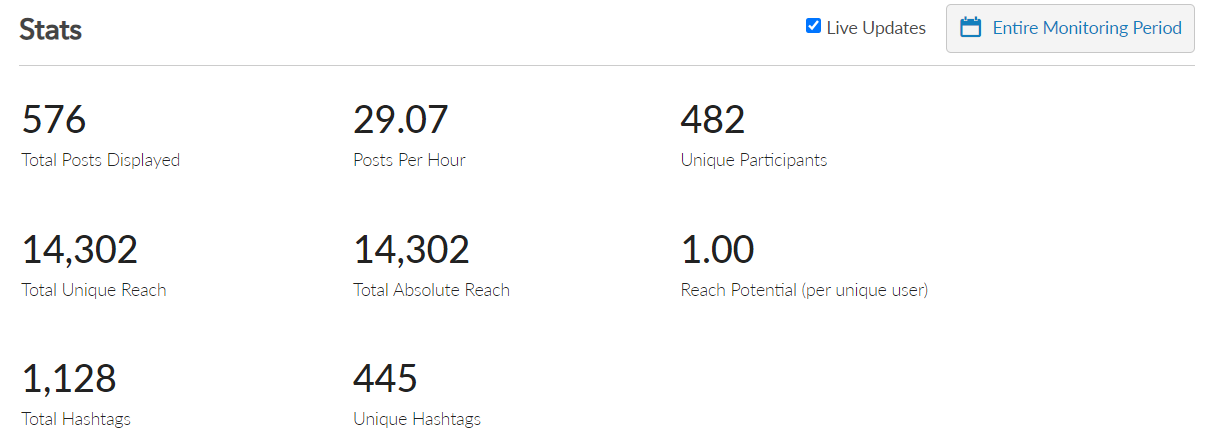
With Everwall, we collect various stands and metrics related to the content we pull in from various content sources. We make this information available to you on the Stats page so you can assess and measure the engagement of the audience to an event or campaign.
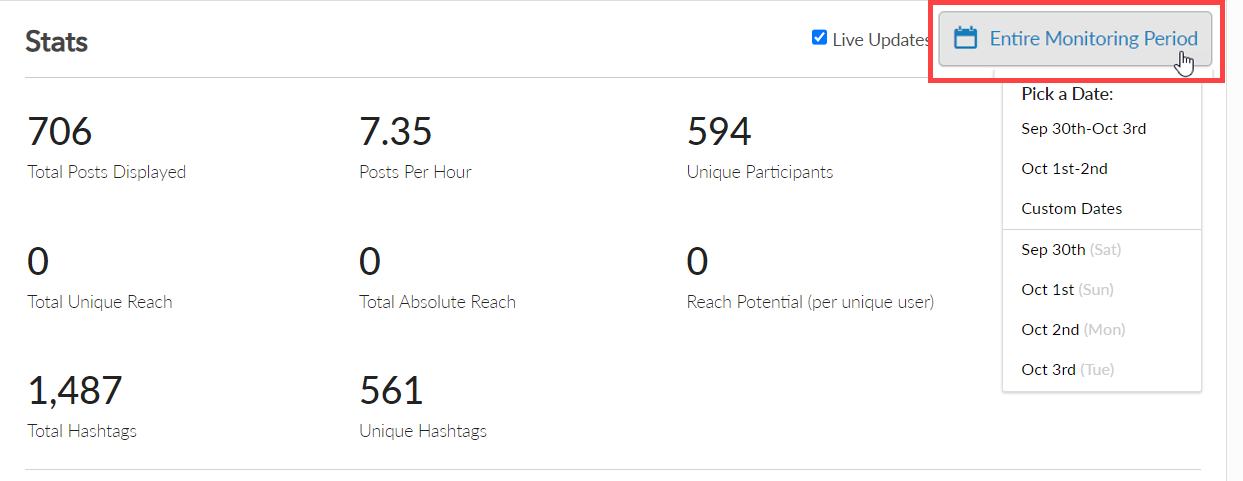
By default, it’ll show the stats for your event dates only, but you can easily change it to show the entire monitoring period, a specific date, or even multiple dates.
By default we provide the following information:
- Displayed Posts
- Unique Reach
- Absolute Reach
- Number of Participants
- Languages Used
- Estimated Genders of Participants
- Content Source Usage
- Hashtags Used
How to Access Your Stats
Below you’ll find instructions for how to access the stats for your Social Walls, Ongoing Walls or Social Media Hubs.
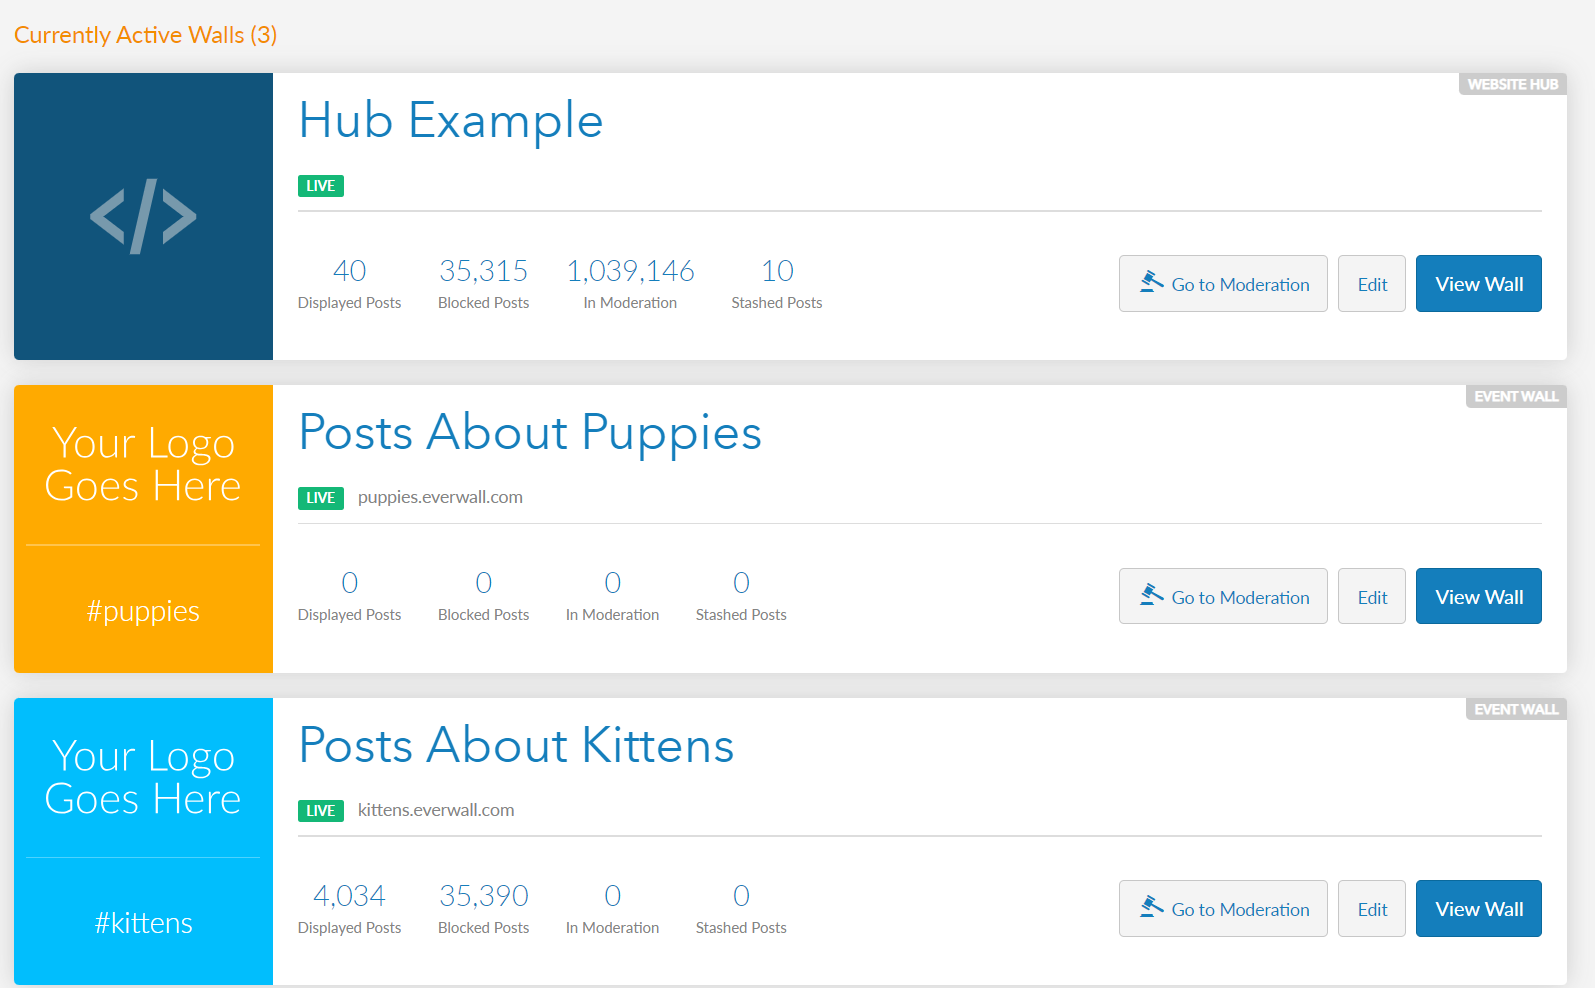
Step 1: Select which wall you want to access the stats.
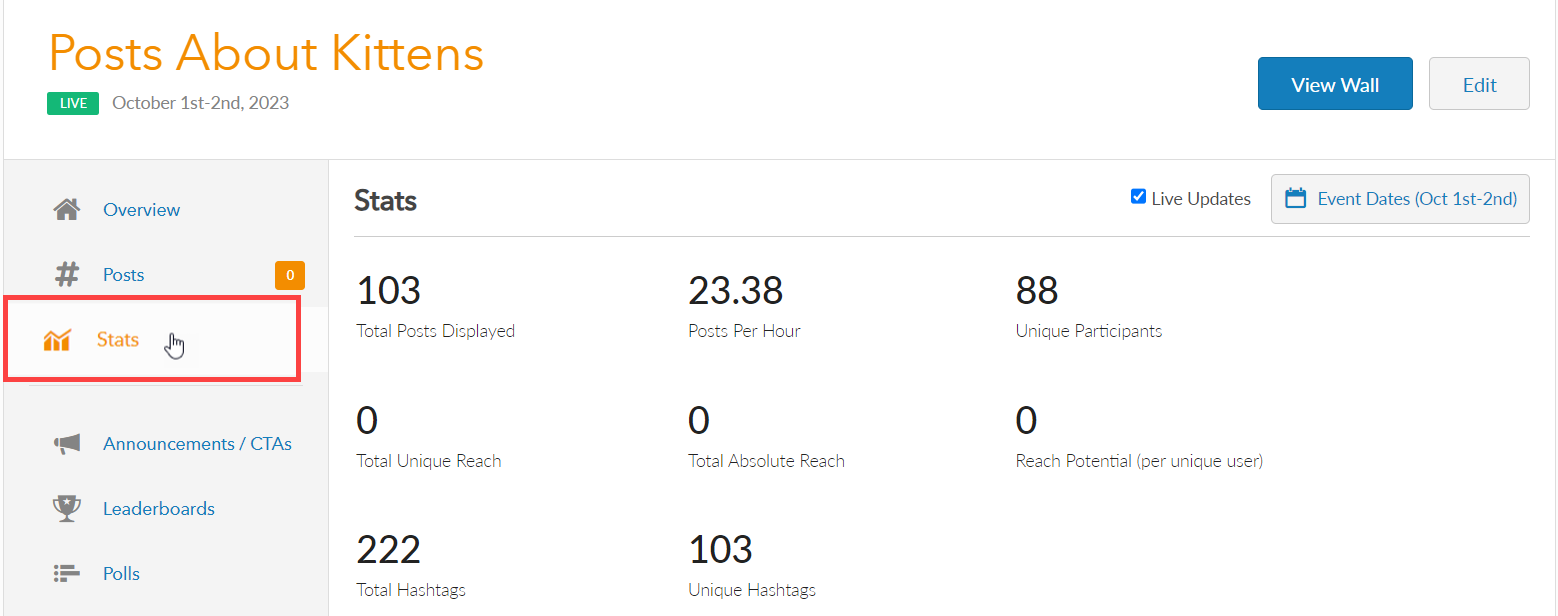
Step 2: Click on the Stats link in the side menu to access the stats page.
Step 3: Select a specific date(s) of the stats you want to display.
The first section of the page shows the summary details of the stats
- Total Posts Displayed
- Posts Per Hour
- Unique Participants
- Total Unique Participants
- Total Unique Reach
- Total Absolute Reach
- Reach Potential (per unique user)
- Total Hashtags
- Unique Hashtags

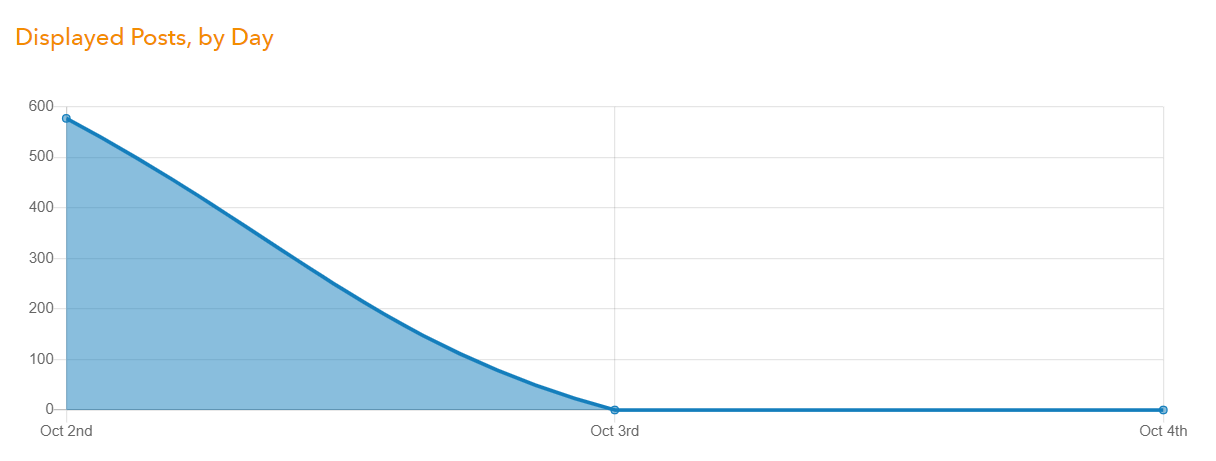
The second section shows the graph of the displayed posts per day within the specified data range. However, if you set a specific date of the stats report, it will show you the graph of displayed posts per hour.
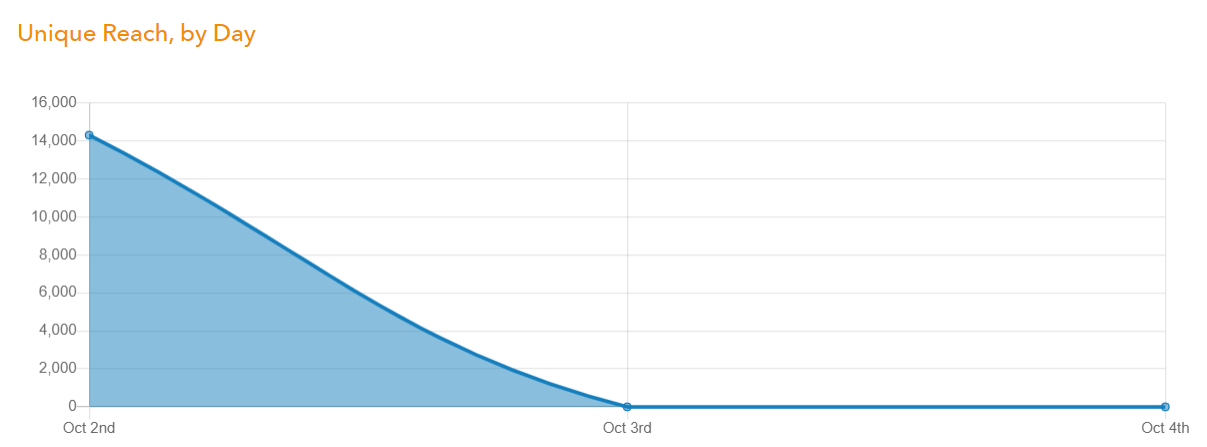
The third section shows the graph of unique reach per day which counts the followers each and every time that a user sends a post. However, if you set a specific date of the stats report, it will show you the graph of unique reach per hour.
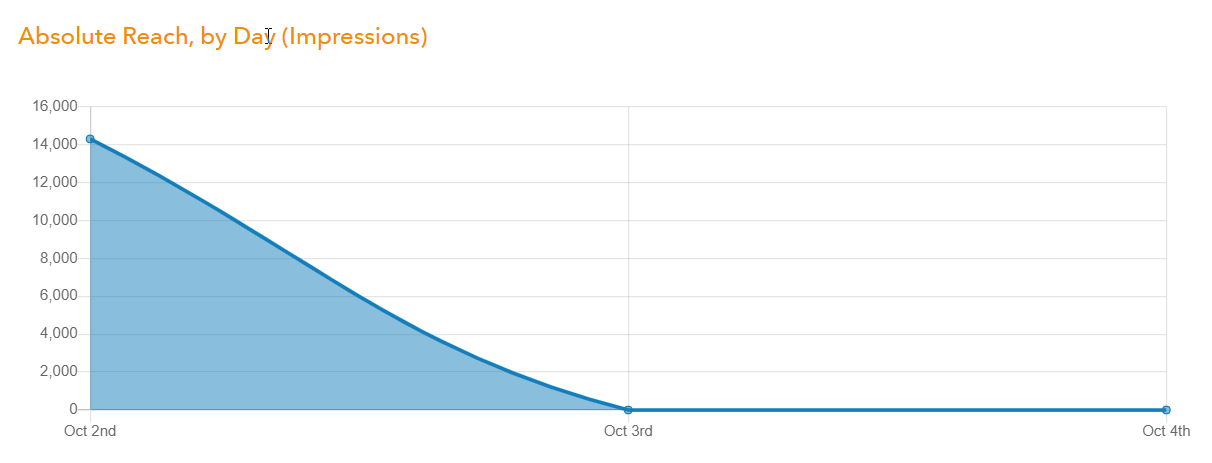
The fourth section shows the graph of absolute reach per day which counts the followers once per day. However, if you set a specific date of the stats report, it will show you the graph of absolute reach per hour.
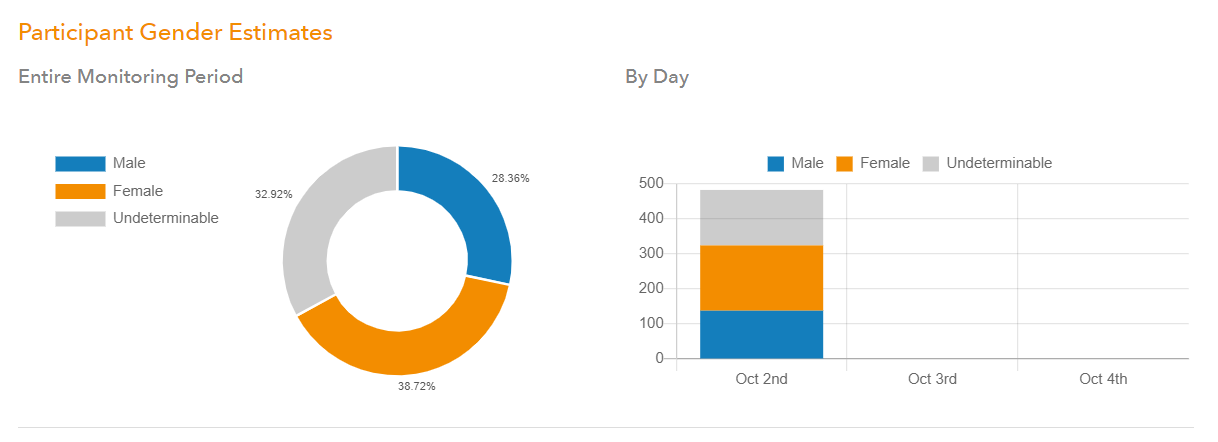
The fifth section shows the chart of the participant gender estimates per day. There are 2 different charts; the pie chart and the horizontal bar chart which displays the percentage of the male and female participants who posted on your wall within the selected dates. The gender was based on the username, if ever we were unable to identify the gender, it will be classified as undeterminable.
If you set a specific date of the stats report, it will show you the participants gender estimates per hour.
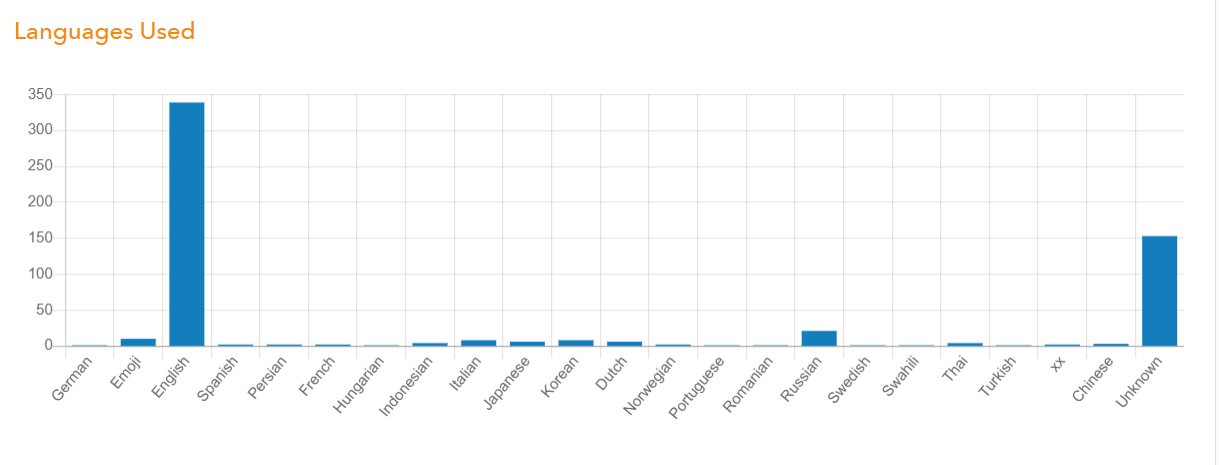
The sixth section shows the chart of the language used in the social wall. The system analyzed all the languages extracted from the content sources, which comprised the texts from the posts. If the system was unable to recognize the words or texts from the posts. They will automatically be considered as unknown.
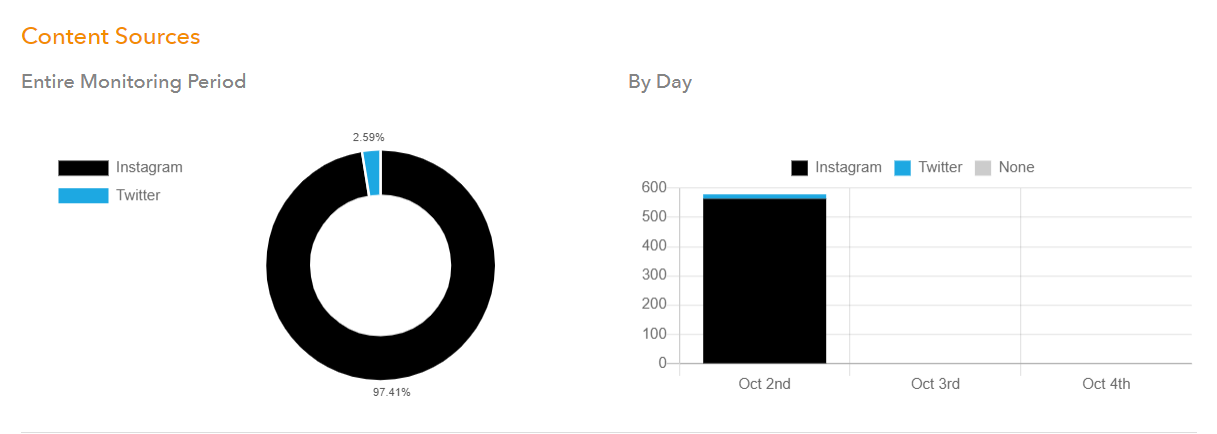
The seventh section is the content sources percentage per day. There are 2 different charts; the pie chart and the horizontal bar chart both of which depict the proportion of content sources extracted from the posts .
The last section shows the top hashtags posted on your wall along with the count of posts that include each of these hashtags. The hashtags are linked to the search posts page which will show you all the posts that use the hashtags you clicked.

Still have questions? Get in touch.